
HF017
Vegetation Patterns of a New England Sand Plain in Montague MA 1993-1995
Related PublicationsData
- hf017-01: soil (field) (preview)
- hf017-02: soil (lab) (preview)
- hf017-03: age structure (preview)
- hf017-04: understory cover (preview)
- hf017-05: plot (preview)
- hf017-06: tree (preview)
- hf017-07: vegetation (preview)
- hf017-08: species list (preview)
- hf017-09: Montague Plain study area showing the location of sample plots
- hf017-10: frequency of occurrence (%) of common plant species on plowed vs. unplowed sites on the Montague Plain.
Overview
- Lead: David Foster, Glenn Motzkin
- Investigators: Arthur Allen, Richard Boone, Jon Harrod
- Contact: Information Manager
- Start date: 1993
- End date: 1995
- Status: complete
- Location: Montague Plain (Montague MA)
- Latitude: +42.57 degrees
- Longitude: -72.52 degrees
- Elevation:
- Datum: WGS84
- Taxa:
- Release date: 2023
- Language: English
- EML file: knb-lter-hfr.17.22
- DOI: digital object identifier
- EDI: data package
- DataONE: data package
- Related links:
- Study type: short-term measurement
- Research topic: physiological ecology, population dynamics and species interactions; regional studies
- LTER core area: disturbance patterns, land use and land cover change
- Keywords: conservation, fires, land use, oak, pine, soil, vegetation dynamics
- Abstract:
For details on methods and results, please see the published paper (Motzkin, G., D. Foster, A. Allen, J. Harrod and R. D. Boone. 1996. Controlling site to evaluate history: vegetation patterns of a New England sand plain. Ecological Monographs 66: 345-365). The Abstract from the paper is reproduced below.
"The widespread and long-lasting impact of human activity on natural eco-systems indicates that land-use history must be treated as an integral aspect of ecological study and a critical component of conservation planning. The New England landscape has undergone a complete transformation as forests were converted to agriculture in the 18th and 19th centuries followed by succession to woodland as a result of widespread agricultural abandonment. Despite the prevalence of human impacts, the effect and longevity of land-use practices on modern forest conditions are poorly understood. In the present study of pitch pine - scrub oak vegetation on a sand plain in the Connecticut Valley of Massachusetts, we address the following questions: (1) what is the relative importance of human and natural disturbance and environmental factors in controlling vegetation composition, structure, and landscape patterns; (2) what are the mechanisms underlying human impacts on vegetation, and what is the duration of these impacts; and (3) what are the implications of land-use history for the interpretation and conservation of these communities? Sand plain vegetation was selected for investigation because the homogeneity of site conditions facilitates the interpretation of land-use and natural disturbance impacts, and because the uncommon vegetation and constituent species are priorities for conservation efforts.
"Paleoecological data suggest that pre-European fires were common on the study area, perhaps ignited by a large regional Indian population. The area was noted historically as an extensive pine plain and was used for wood products from the 18th to the mid-19th century. Eighty-two percent of the area was subsequently plowed for agriculture before being abandoned in the early 20th century.
"Soil analyses confirm the homogeneity of site conditions and suggest that land uses (plowing, woodlot/pasture) were determined according to ownership pattern rather than site factors. Previously cultivated parcels have distinct Ap (plow horizons) 15 - 33 cm deep, whereas uncultivated parcels have A horizons 3 - 10 cm in depth. Soil physical and chemical characteristics are similar among land uses and modern vegetation types.
"Aerial photographs document a dramatic transformation in plant cover over the last 50 yr. In 1939, the vegetation was grassland or shrub-heath (49%), open-canopy forest (29%), and scrub-oak shrublands (15%). In 1985, 73% of the study area was forested with pitch pine (40%), hardwood (12%), or mixed stands (21%), 9% was in open-canopy stands, and 3% was covered by grass or shrubs.
"Vegetation/land-use relations are striking. Pitch pine occurs almost exclusively (97%) on former plowed sites, whereas scrub oak stands occur preferentially (89%) on sites that have not been plowed. Land use explains the greatest variation in modern vegetation as well as the distribution and abundance of many taxa. Fire has been common across the study area but has influenced vegetation largely within patterns resulting from prior land use. Land-use patterns and factors controlling vegetation composition and structure are broadly paralleled at similar sites elsewhere in the Connecticut Valley.
"The study indicates that conservation biologists interested in preserving species, communities, and landscape patterns on sand plains in the northeastern United States need to incorporate a dynamic perspective of biological systems that includes the overriding impact of prior land use. In order to appreciate, study, and display these land-use and vegetation patterns it is essential to conserve the mosaic of assemblages and historical uses within a landscape setting."
- Methods:
Soil Field Data
Two pits (each ~1 m3) were dug and described in each of 121 permanent plots (see archived GIS study area maps with digitized plot locations) established according to historical ownership and modern vegetational patterns across the plain. All organic and mineral horizons were described into the upper substratum and samples were taken of the forest floor and mineral soil (0-30 cm) for physical and chemical analyses.
One profile in each pit was described from the top of the forest floor (O layers) through the solum (A and B horizons) into the substratum (C horizon). Mineral soil surface was used as zero depth. All colors were determined on moist samples unless otherwise noted. All profile descriptions and nomenclature followed standard Soil Conservation Service procedures as defined in the Soil Survey Manual (U.S.D.A. Agricultural Handbook No.18).
Soil Lab Data
Forest floor (Oe and Oa horizons) and mineral soil (0-15 cm depth) were sampled in two described pits in each of 121 permanent plots (see archived GIS study area maps with digitized plot locations) established according to historical ownership and modern vegetational patterns across the plain. Samples were brought to the Harvard Forest and analyzed for coarse fragments, organic matter, pH, and bulk density.
Organic samples - One sample (15 cm x 15 cm x full depth) of the Oe+Oa horizons combined was collected per pit. After air-drying, samples were sieved to less than 5.6 mm and both fractions were weighed. Subsamples (less than 5.6 mm) were oven-dried (105 C) to obtain an air-dry:oven-dry conversion factor, then combusted (550 C for 4 hrs.) to obtain organic matter content. pH was determined for air-dried samples (1:10, organic layers:water).
Mineral samples - One sample was collected per pit at 0-15 and 15-30 cm depths with a 5.08 x 15.00 cm cylindrical steel corer. After air-drying, samples were sieved to les than 2.0 mm and both fractions were weighed. Subsamples (less than 2 mm) were oven-dried (105 C) to obtain an air-dry:oven-dry conversion factor, then combusted (550 C for 4 hrs.) to obtain organic matter content. pH was determined for air-dried samples (1:2, mineral soil:water). Bulk Density was calculated based on oven-dry less than 2 mm soil weight and sample volume, corrected for coarse fragment (greater than 2mm) weight and volume.
Age Structure Data
At 11 permanent 20m x 20m square plots (see archived maps and directions for plot locations), we cored all trees >2.5 cm DBH.
Increment cores were taken from within 30 cm of ground surface. Cores were dried, mounted, sanded, and counted using a hand lens or dissecting microscope as necessary. In plot 22, a basal section was taken from the largest scrub oak stem in each clump of sprouts.
Understory Cover Data
At 121 permanent 20m x 20m square plots (see archived maps and directions for plot locations), we estimated cover abundance for all herbs, shrubs, and trees less than 2.5 cm DBH. Plots were located within stands within historical parcel boundaries.
Eight cover-abundance classes were used for the understory: 1=rare, less than 1%; 2=few, less than 5%; 3=numerous, less than 5%; 4=5-15%; 5=16-25%; 6=26-50%; 7=51-75%; 8=greater than 75%. Overstory and understory individuals of the same species were treated as separate species.
Plot Data
At 121 permanent 20m x 20m square plots (see archived maps and directions for plot locations), we recorded the presence (Y) or absence (N) of evidence of past fires or plowing. Plots were located within stands within historical parcel boundaries.
Methods involved visual inspection of plot to note disturbance indicators.
Tree Data
At 121 permanent 20m x 20m square plots (see archived maps and directions for plot locations), we measured DBH of all tree stems greater than 2.5 cm DBH. Sprouts were indicated, as were dead trees. Plots were located within stands within historical parcel boundaries.
In order to relate tree abundance to understory cover values, the maximum live basal area for a single species on a plot (pitch pine=45.9 m2/ha) was assigned a value of 100%. Basal area classes corresponding to the 8 cover- abundance classes used for the understory (1=rare, less than 1%; 2=few, less than 5%; 3=numerous, less than 5%; 4=5-15%; 5=16-25%; 6=26-50%; 7=51-75%; 8=greater than 75%) were then calculated as a percentage of this maximum. Overstory and understory individuals of the same species were treated as separate species.
Vegetation Data
At 121 permanent 20m x 20m square plots (see archived maps and directions for plot locations), we measured DBH of all tree stems greater than 2.5 cm DBH and estimated cover abundance (in 8 classes) for live herbs, shrubs, and trees less than 2.5 cm DBH. Plots were located within stands within historical parcel boundaries. This data file was used in DCA and CCA analyses.
In order to relate tree abundance to understory cover values, the maximum live basal area for a single species on a plot (pitch pine=45.9 m2/ha) was assigned a value of 100%. Basal area classes corresponding to the 8 cover- abundance classes used for the understory (1=rare, less than 1%; 2=few, less than 5%; 3=numerous, less than 5%; 4=5-15%; 5=16-25%; 6=26-50%; 7=51-75%; 8=greater than 75%) were then calculated as a percentage of this maximum. Overstory and understory individuals of the same species were treated as separate species.
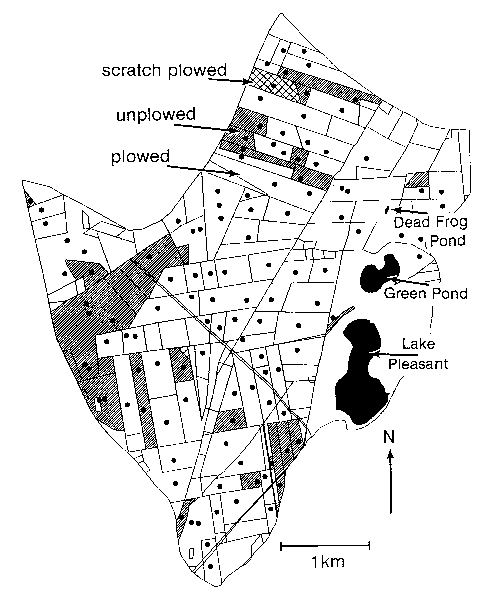
Map
The Montague Plain study area showing the location of sample plots within historical ownership and land-use boundaries determined by presence of Ap horizons: white = formerly plowed; narrow diagonal shading = unplowed; cross-hatched shading = minimally or scratch plowed. Stratification of sampling within stands delineated from 1985 aerial photos (not shown) accounts for parcels with more than one sample plot. (From Motzkin et al., Ecological Monographs 66:345-365, 1996).
Figure
Frequency of occurrence (%) of common plant species on plowed vs. unplowed sites on the Montague Plain. Only species occuring on at least 25 plots (20% of total) are shown. Significance of G-tests is indicated at the P less than 0.05 (*) and P less than 0.01 (**) levels after accounting for multiple comparisons. (From Motzkin et al., Ecological Monographs 66:345-365, 1996).
- Organization: Harvard Forest. 324 North Main Street, Petersham, MA 01366, USA. Phone (978) 724-3302. Fax (978) 724-3595.
- Project: The Harvard Forest Long-Term Ecological Research (LTER) program examines ecological dynamics in the New England region resulting from natural disturbances, environmental change, and human impacts. (ROR).
- Funding: National Science Foundation LTER grants: DEB-8811764, DEB-9411975, DEB-0080592, DEB-0620443, DEB-1237491, DEB-1832210.
- Use: This dataset is released to the public under Creative Commons CC0 1.0 (No Rights Reserved). Please keep the dataset creators informed of any plans to use the dataset. Consultation with the original investigators is strongly encouraged. Publications and data products that make use of the dataset should include proper acknowledgement.
- License: Creative Commons Zero v1.0 Universal (CC0-1.0)
- Citation: Foster D, Motzkin G. 2023. Vegetation Patterns of a New England Sand Plain in Montague MA 1993-1995. Harvard Forest Data Archive: HF017 (v.22). Environmental Data Initiative: https://doi.org/10.6073/pasta/f60103a3b8ad19754d8a2a7ccae4e491.
Detailed Metadata
hf017-01: soil (field)
- plot: sampling plot number (1-121)
- parcel: historical ownership parcel number
- stand: 1985 Aerial photo stand types (1-22)
- pit: Soil pit within plot
- A: soil pit A
- B: soil pit B
- oitop: height of fibric layer upper surface above mineral surface (unit: centimeter / missing value: NA)
- oetop: height of hemic layer upper surface above mineral surface (unit: centimeter / missing value: NA)
- oatop: height of sapric layer upper surface above mineral surface (unit: centimeter / missing value: NA)
- atop: depth of A horizon upper surface, usually zero (unit: centimeter / missing value: NA)
- etop: depth of E horizon upper surface below mineral surface (unit: centimeter / missing value: NA)
- b1top: depth of first B horizon upper surface below mineral surface (unit: centimeter / missing value: NA)
- b2top: depth of second B horizon upper surface below mineral surface (unit: centimeter / missing value: NA)
- ctop: depth of first C horizon upper surface below mineral surface (unit: centimeter / missing value: NA)
- appres: whether Ap horizon present
- TRUE: Ap horizon present
- FALSE: Ap horizon absent
- abound: description of boundary at base of A horizon
- atext: texture of A horizon
- acolor: Munsell system color of A horizon
- astru: structure of A horizon
- etext: texture of E horizon
- ecolor: Munsell color of E horizon
- estru: structure of E horizon
- b1tex: texture of first B horizon
- b1color: color of first B horizon
- b1stru: structure of first B horizon
- b2tex: texture of second B horizon
- b2color: Munsell color of second B horizon
- ctext: texture of C horizon
- ccolor: color of C horizon
- frtdep: depth at which 99% of fine roots have ceased (unit: centimeter / missing value: NA)
- charcoal: presence/absence of charcoal below the mineral surface present
- TRUE: presence of charcoal below the mineral surface
- FALSE: absence of charcoal below the mineral surface
- notes: notes
hf017-02: soil (lab)
- plot: sampling plot number
- pit: soil pit within plot (a, b)
- depth: sample depth
- 0-15cm: organic
- 15-30cm: mineral
- totwt: air-dry weight, unsieved (unit: gram / missing value: NA)
- sievwt: air-dry weight; <2 mm fraction (unit: gram / missing value: NA)
- coarwt: air-dry weight; >2 mm fraction (unit: gram / missing value: NA)
- ph: pH of sample in water (1:2;mineral soil:water, 1:10; organic:water) (unit: number / missing value: NA)
- adod: ratio of air:oven (105 C) dry weights (unit: number / missing value: NA)
- om: organic matter concentration (%) (unit: number / missing value: NA)
- bd: bulk density; mineral samples only, corrected for coarse fragments (unit: gramsPerCubicCentimeter / missing value: NA)
hf017-03: age structure
- plot: sampling plot number
- parcel: parcel number
- stand: 1985 stand type from aerial photos
- treenum: tree number within a plot
- species: species
- ACRU: Acer Rubrum
- AMSP: Amelachier sp.
- BEPA: Betula papyrifera
- BEPO: Betula populifolia
- PIRI: Pinus rigida
- PIST: Pinus strobus
- PISY: Pinus sylvestris
- POTR: Populus tremuloides
- PRSE: Prunus serotina
- QUAL: Quercus alba
- QUCO: Quercus coccinea
- QUIL: Quercus Ilicifolia
- QURU: Quercus rubra
- QUVE: Quercus velutina
- dbh: diameter at breast height (unit: centimeter / missing value: NA)
- sound: Is tree sound or rotten/hollow?
- N: no
- Y: yes
- spr: whether sprout from stump or isolated trunk
- N: isolated trunk
- Y: sprout from stump
- sprouts: sprouts are indicated with the same TREENUM
- char: whether tree is charred
- N: not charred
- Y: charred
- lean: whether the tree leaning
- N: not leaning
- Y: leaning
- dir: direction (degrees) in which tree leans (unit: degree / missing value: NA)
- comm: comments
- age: actual ring count (unit: number / missing value: NA)
- corr: estimated number of additional rings to pith (unit: number / missing value: NA)
hf017-04: understory cover
- plot: sampling plot number (1-121)
- parcel: parcel number
- stand: 1985 stand type from aerial photos
- species: 4-letter acronym; see species list
- cover: cover-abundance class (1-8)
hf017-05: plot
- plot: sampling plot number (1-121)
- parcel: parcel number
- stand: stand type determined from 1985 aerial photos
- plowed: presence/absence of Ap horizon
- Y: presence of Ap horizon
- N: absence of Ap horizon
- scars: presence/absence of fire scars
- Y: presence of fire scars
- N: absence of fire scars
- charred: presence of bark charring
- Y: presence of bark charring
- N: absence of bark charring
- charcoal: presence/absence of soil charcoal
- Y: presence of soil charcoal
- N: absence of soil charcoal
- cut: evidence of past cutting
- Y: evidence of past cutting
- Y: no evidence of past cutting
hf017-06: tree
- plot: sampling plot number (1-121)
- parcel: parcel number
- stand: 1985 stand type from aerial photos
- species: 4-letter acronym; see species list
- dbh: Diameter at Breast Height (unit: centimeter / missing value: NA)
- dead: dead
- N: alive
- Y: dead
- sprouts: sprouts were assigned the same number (unit: number / missing value: NA)
hf017-07: vegetation
- plot: sampling plot number (1-121)
- species: species number, see species list
- cover: cover-abundance/basal area class
hf017-08: species list
- species.number: species number
- species.code: 4-letter species code
- species.name: species name
hf017-09: Montague Plain study area showing the location of sample plots
- Compression: none
- Format: gif
- Type: image
hf017-10: frequency of occurrence (%) of common plant species on plowed vs. unplowed sites on the Montague Plain.
- Compression: none
- Format: gif
- Type: image