
HF032
Lyford Mapped Tree Plot at Harvard Forest since 1969
Related PublicationsData
Overview
- Lead: David Foster, Audrey Barker Plotkin, Walter Lyford
- Investigators: Ann Lezberg
- Contact: Information Manager
- Start date: 1969
- End date: 2021
- Status: ongoing
- Location: Prospect Hill Tract (Harvard Forest)
- Latitude: +42.53 degrees
- Longitude: -72.18 degrees
- Elevation: 345 meter
- Datum: WGS84
- Taxa: Acer rubrum (red maple), Quercus rubra (red oak)
- Release date: 2023
- Language: English
- EML file: knb-lter-hfr.32.22
- DOI: digital object identifier
- EDI: data package
- DataONE: data package
- Related links:
- Study type: long-term measurement
- Research topic: large experiments and permanent plot studies; physiological ecology, population dynamics and species interactions
- LTER core area: population studies
- Keywords: maple, oak, permanent plots, soil, tree maps, vegetation dynamics
- Abstract:
Permanent forest plots provide an empirical understanding of forest change over time, and are an invaluable part of forestry and ecological research. Walter Lyford began measurements of a 2.88 ha red oak-red maple forest on the Prospect Hill Tract of Harvard Forest in 1969. All trees over 2 inches (5 cm) were mapped on very large-scale (1 inch = 5 feet) hand-drawn maps, and included live and dead trees, stumps, windthrows and other features such as stone walls, boulders, soil moisture and a damage boundary from the 1938 hurricane. All living and dead trees have been re-located and measured (diameter at breast height, canopy class for live trees; condition, decay class, diameter, bole length and stem orientation for fallen dead trees) in 1969, 1975, 1987-1992, 2001, and 2011. In 2001, the original, hand-drawn maps were digitized using ArcView GIS.
From 1969 to 2011, red oak (Quercus rubra) increased its dominance of the stand’s total basal area from 52% to 60%; however, red maple (Acer rubrum) has become relatively less abundant, decreasing from 30% to 23%. While red oak and red maple continue to account for the majority of the basal area in the stand, the secondary species experienced a dramatic increase in relative abundance of individuals in the stand; yellow birch (Betula alleghaniensis), black birch (Betula lenta), American chestnut (Castanea dentata), American beech (Fagus grandifolia), witch hazel (Hamamelis virginiana), eastern white pine (Pinus strobus), and eastern hemlock (Tsuga canadensis) have increased from comprising 25% of the individuals in the stand in 1969 to comprising 52% in 2011. The total biomass of living individuals is increasing linearly (R2=0.99, p=0.0002), which implies that the stand has not yet experienced an age-induced decrease in biomass accumulation.
- Methods:
Sampling History
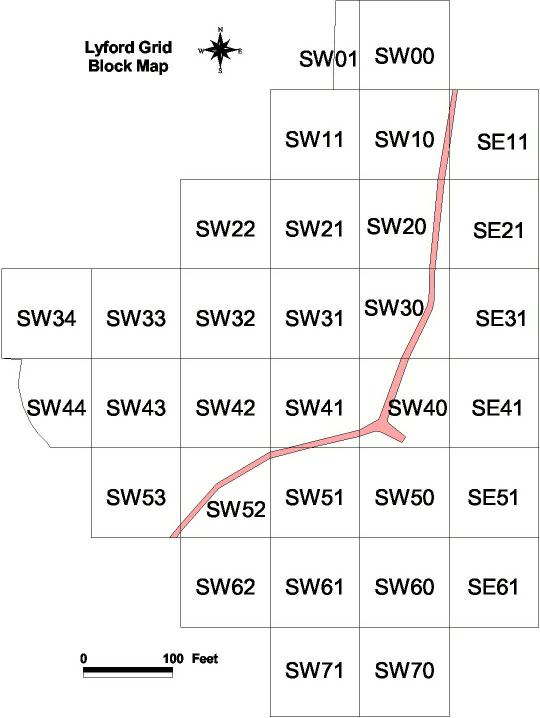
Detailed tree maps were prepared by Walter Lyford over this 2.88 ha area between 1962-1969. Map accuracy is within 1-2 feet. Maps cover 32, 100x100 ft. blocks; each block is marked in the field with labeled wooden stakes. The entire site was censused in 1969 and 1975, between 1987 and 1992, 2001, and 2011.
Blocks censused in 1987: SE61, SW60, SW61, SW62, SW70, SW71. Blocks censused in 1991: SE11, SE21, SE31, SE41, SE51, SW10, SW11, SW20, SW22, SW30, SW40, SW50, SW51. Blocks censused in 1992: SW00, SW01, SW21, SW31, SW32, SW33, SW34, SW41, SW42, SW43, SW44, SW52, SW53.
2011 Method Notes
Each grid block was temporarily flagged around its boundaries with measuring tapes. It helped to use ones that had both feet and meters on it. We did not find it necessary to mark out 10ft. intervals with staked flags or divide the blocks into subsections.
To locate individual trees, we used the ArcView maps created in 2001. We matched individuals in the field to the entries on the datasheets based on their coordinates, species, and historical measurements. We were able to successfully navigate through the blocks using these GIS maps, although it would be easier to see the numbers on the maps if they were shifted slightly, to avoid having overlapping numbers in instances where trees share a base.
For each tree, data on dbh, canopy position (dominant, codominant, intermediate, or suppressed), and condition (living, dead, snapped, stump, rootbreak, windthrown, or windthrown and cut) were recorded. Diameter was measured with a diameter tape to the nearest 0.1cm, and was recorded in centimeters. Diameters of some dead and all fallen trees were recorded with calipers. When it was necessary to measure living trees with calipers, this was noted on the datasheets. A condition of "dead" was applied to all individuals with at least 4.5ft of stem still standing. For any length of standing bole less than 4.5ft, the tree was scored as snapped. For fallen stems (and the tops of standing dead trees, when the crown was easily evident on the ground), length in feet, orientation in degrees true north, and diameters were taken when possible. Both dead standing and fallen stems were assigned a decay class. A 3 tiered decay scale was used:
D1=firm/solid, fresh, small twigs or stubs intact
D2= partial decay, bark may be partially missing, bole may be broken but shape is still evident
D3= decaying into ground/soil, crumbled, often fully or partially buried
If the tree was cut by a beaver, it was listed as snapped for the condition, and the note "beaver" in the comments section. If a tree could not be located (almost always previously dead trees that had rotted away, and in a handful of instances, missing trees), the tree was scored as "gone." If a tree had been scored as "gone" previously, we did not attempt to relocate it. Comments included the orientation of leaning, living stems, the presence of basal and or trunk sprouts, and the presence of dead branches, top snaps, and dead leaders as necessary. Trees were marked with chalk to track progress.
New trees (stems that had grown above 5cm dbh since the last census) were added to the dataset; diameter, canopy class, species, and condition were noted. Stems greater than 5 cm dbh that were fused to another individual, or growing as a vertical branch of a fallen prostrate tree were scored as new individuals. New individuals were marked with flagging. Coordinates were determined by measuring from a very nearby tree with known coordinates (within 1 ft), or by measuring the distance from the boundary tape to the individual. When these methods were not possible, the "INTERPNT method" of triangulation (Boose et al. 1998, Ecology 79:819-827) was used. Distances from the new tree to three nearby reference points (trees with known coordinates) were measured in the field in feet and later converted to meters. We checked approximately 26 trees in the field that either failed the first or second tolerance levels (0.3 meters and 1 meter, respectively) or returned a result of an open triangle. After one round of remeasurement, only three trees exceeded the 0.3m tolerance level, and a field check confirmed that the coordinates appeared to be accurate. Coordinates generated by INTERPNT were converted to the nearest half foot.
2021 Notes
For downed dead trees, we added measurements of base and top diameter, to allow more accurate volume and mass estimates for these trees. For most of the new recruits, we measured the distance and angle (using a compass) from a known tree and calculated the XY coordinates of the new tree using trigonometry.
2001 GIS Methods
Our objective was to translate most of the information on Lyford's hand-drawn maps to digital format. We used ArcView 3.2 software, and spatial information from the original 22x22 inch maps was digitized using a digitizing tablet (Summagraphics Microgrid II). Most themes are polygons, including stonewalls and roads, since the map scale is so large. The following themes were created:
Block corners (just the coordinates where the grid posts are located - a point theme); block polygons were created by connecting the dots and modifying SW01 (incompletely surveyed) and SW44 (incomplete as part of block is in swamp and was not surveyed).
Trees (point theme derived from coordinates in data table). Footpath (line theme). Intermittent streams (line theme). Soil moisture type (polygon). Area damaged by 1938 hurricane (polygon). Road (polygon). Woods road (polygon - not very evident on ground anymore). Stonewalls (polygon).
Manipulations (polygon). Some experimental sites are still evident on the ground. Nitrogen fertilization treatments done by Lyford in separate theme.
Rocks (patchy coverage - Lyford drew in boulders only on some maps (greater than 2ft. diam.) and both boulders and rocks (1-2ft. diam.) on others).
Fallen stems (line). Endpoints of each fallen stem were calculated from length and bearing measurements, using an extension called "bearing.avx" written by Yingming Zhou. A line theme was created from these points using an ArcView extension called "drawline2.ave" written by Rodrigo Nobrega. In some cases, we noted that the bole was displaced from the tree base - the X,Y coordinates were adjusted accordingly only if both amount and direction of displacement were noted.
- Organization: Harvard Forest. 324 North Main Street, Petersham, MA 01366, USA. Phone (978) 724-3302. Fax (978) 724-3595.
- Project: The Harvard Forest Long-Term Ecological Research (LTER) program examines ecological dynamics in the New England region resulting from natural disturbances, environmental change, and human impacts. (ROR).
- Funding: National Science Foundation LTER grants: DEB-8811764, DEB-9411975, DEB-0080592, DEB-0620443, DEB-1237491, DEB-1832210.
- Use: This dataset is released to the public under Creative Commons CC0 1.0 (No Rights Reserved). Please keep the dataset creators informed of any plans to use the dataset. Consultation with the original investigators is strongly encouraged. Publications and data products that make use of the dataset should include proper acknowledgement.
- License: Creative Commons Zero v1.0 Universal (CC0-1.0)
- Citation: Foster D, Barker Plotkin A, Lyford W. 2023. Lyford Mapped Tree Plot at Harvard Forest since 1969. Harvard Forest Data Archive: HF032 (v.22). Environmental Data Initiative: https://doi.org/10.6073/pasta/d8d6cdabff930d396e2c474e8595ce3c.
Detailed Metadata
hf032-01: tree data
- block: Lyford block ID. See plot map for layout of 100x100 ft. subdivisions of the plot
- meas3y: trees in the ‘1991’ census were actually measured in 1987, 1991 or 1992. The exact measurement year is indicated here.
- treeid: assigned in database; trees not tagged in field but identified by location and species.
- xsite: location within site. These are Cartesian coordinates based on N-S and E-W baselines. (unit: foot / missing value: NA)
- ysite: location within site. These are Cartesian coordinates based on N-S and E-W baselines. (unit: foot / missing value: NA)
- species: tree species
- ACPE: Acer pensylvanicum
- ACRU: Acer rubrum
- ACSA: Acer saccharum
- ALIN: Alnus incana
- AMSP: Amelanchier sp.
- BEAL: Betula alleghaniensis
- BELE: Betula lenta
- BEPA: Betula papyrifera
- BEPO: Betula populifolia
- CADE: Castanea dentata
- FAGR: Fagus grandifolia
- FRAM: Fraxinus americana
- HAVI: Hamamelis virginiana
- NYSY: Nyssa sylvatica
- PIRU: Picea rubens
- PIST: Pinus strobus
- POGR: Populus grandidentata
- PRSE: Prunus serotina
- QUAL: Quercus alba
- QURU: Quercus rubra
- QUVE: Quercus velutina
- TSCA: Tsuga canadensis
- ULSP: Ulmus sp.
- UNK: Unknown
- dbh69: Diameter at breast height (4.5ft.) in 1969 (unit: centimeter / missing value: NA)
- can69: canopy class in 1969
- D: dominant
- CD: codominant
- I: intermediate
- S: suppressed (or lower stratum)
- cond69: condition in 1969
- D: dead
- L: living
- SN: snapped (at less than 50% total height)
- ST: cut stump
- W: windthrown
- WC: windthrown and cut
- dbh75: diameter at breast height (4.5ft.) in 1975, converted from inches (unit: centimeter / missing value: NA)
- can75: canopy class in 1975
- D: dominant
- CD: codominant
- I: intermediate
- S: suppressed (or lower stratum)
- cond75: condition in 1975
- D: dead
- L: living
- SN: snapped (at less than 50% total height)
- ST: cut stump
- W: windthrown
- WC: windthrown and cut
- dbh91: diameter at breast height (4.5ft.) in 1987-1992, converted from inches (unit: centimeter / missing value: NA)
- can91: canopy class in 1987-1992
- D: dominant
- CD: codominant
- I: intermediate
- S: suppressed (or lower stratum)
- cond91: condition in 1987-1992
- D: dead
- G: gone
- L: living
- RB: root break
- SN: snapped (at less than 50% total height)
- ST: cut stump
- W: windthrown
- WC: windthrown and cut
- dbh01: diameter at breast height (4.5ft.) in 2001 (unit: centimeter / missing value: NA)
- can01: canopy class in 2001
- D: dominant
- CD: codominant
- I: intermediate
- S: suppressed (or lower stratum)
- cond01: condition in 2001
- D: dead
- G: gone
- L: living
- RB: root break
- SN: snapped (at less than 50% total height)
- ST: cut stump
- W: windthrown
- WC: windthrown and cut
- orient1969: orientation in 1969
- N: north
- NE: northeast
- E: east
- SE: southeast
- S: south
- SW: southwest
- W: west
- NW: northwest
- dbh11: diameter at breast height (4.5ft.) in 2011 (unit: centimeter / missing value: NA)
- can11: canopy class in 2011
- D: dominant
- CD: codominant
- I: intermediate
- S: suppressed (or lower stratum)
- cond11: condition in 2011
- D: dead
- G: gone
- L: living
- RB: root break
- SN: snapped (at less than 50% total height)
- ST: cut stump
- W: windthrown
- WC: windthrown and cut
- length11: length of downed bole in 2011 (feet to the nearest tenth of foot) (unit: foot / missing value: NA)
- angle11: direction of downed bole in 2011 (degrees, 0 is true N) (unit: degree / missing value: NA)
- decay11: decay class in 2011
- D1: firm/solid, fresh, small twigs or stubs intact
- D2: partial decay, bark may be partially missing, bole may be broken but shape is still evident
- D3: decaying into ground/soil, crumbled, often fully or partially buried
- dbh21: diameter at breast height (4.5ft.) in 2021 (unit: centimeter / missing value: NA)
- can21: canopy class in 2021
- D: dominant
- CD: codominant
- I: intermediate
- S: suppressed (or lower stratum)
- cond21: condition in 2021
- D: dead
- G: gone
- L: living
- RB: root break
- SN: snapped (at less than 50% total height)
- ST: cut stump
- W: windthrown
- WC: windthrown and cut
- length21: length of downed bole in 2021 (feet to the nearest tenth of foot) (unit: foot / missing value: NA)
- angle21: direction of downed bole in 2021 (degrees, 0 is true N) (unit: degree / missing value: NA)
- decay21: decay class in 2021
- D1: firm/solid, fresh, small twigs or stubs intact
- D2: partial decay, bark may be partially missing, bole may be broken but shape is still evident
- D3: decaying into ground/soil, crumbled, often fully or partially buried
- dbot21: diameter at the base of a downed dead tree in 2021 (unit: centimeter / missing value: NA)
- dtop21: diameter at the top end of a downed dead tree in 2021 (unit: centimeter / missing value: NA)
- comments: comments, identified by year
- soilmoist: soil moisture from Lyford’s hand-drawn maps
- Dry: dry
- Moist: moist
- Muck: muck
- Water: water
- Wet: wet
- hurrdam: damage from 1938 hurricane based on Lyford’s hand-drawn maps and corroborated by Rowlands’ maps of hurricane damage across the Harvard Forest
- low: low damage
- moderate: moderate damage
- severe: severe damage
- edge10m: tree location relative to the edge of the plot
- 0: tree is more than 10m from the plot edge
- 1: tree is less than 10m from the plot edge
- can62: canopy class in 1962
- D: dominant
- CD: codominant
- I: intermediate
- S: suppressed (or lower stratum)
- cond62: condition in 1962
- D: dead
- L: living
- ST: cut stump
- W: windthrown
- WC: windthrown and cut
- dbh62: diameter at breast height (4.5ft.) in 1962 (unit: centimeter / missing value: NA)
hf032-02: Lyford plot map
- Compression: none
- Format: jpeg
- Type: image