
HF069
Biomass Inventories at Harvard Forest EMS Tower since 1993
Related PublicationsData
- hf069-01: LAI plot-level (preview)
- hf069-02: LAI site-level (preview)
- hf069-03: litter chemistry (preview)
- hf069-04: canopy chemistry (preview)
- hf069-05: litterfall (preview)
- hf069-06: litter decomposition (preview)
- hf069-07: soil moisture (preview)
- hf069-08: soil respiration (preview)
- hf069-09: EMS plots tree summary (preview)
- hf069-10: harvest plot tree summary (preview)
- hf069-11: understory tree summary (preview)
- hf069-12: biomass and basal area summary (preview)
- hf069-13: coarse woody debris (preview)
- hf069-14: fine woody debris (preview)
- hf069-15: understory summary (preview)
- hf069-16: EMS plots annual summary (preview)
- hf069-17: harvest plots annual summary (preview)
- hf069-18: soil temperature and water content 2007-2017 (preview)
- hf069-19: soil temperature and water content since 2017 (preview)
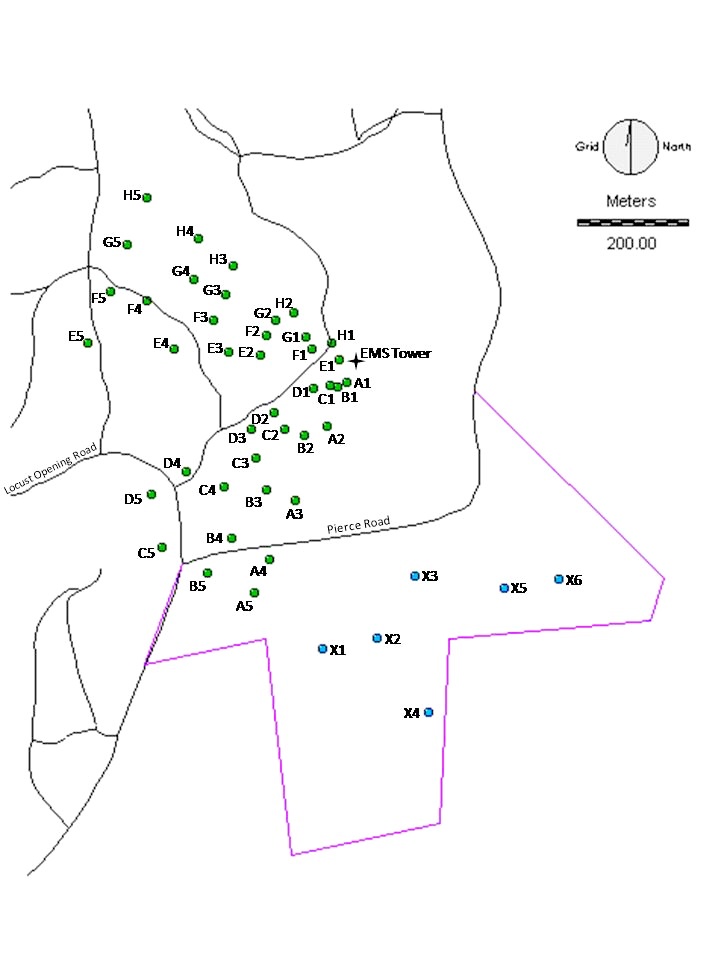
- hf069-20: plot map
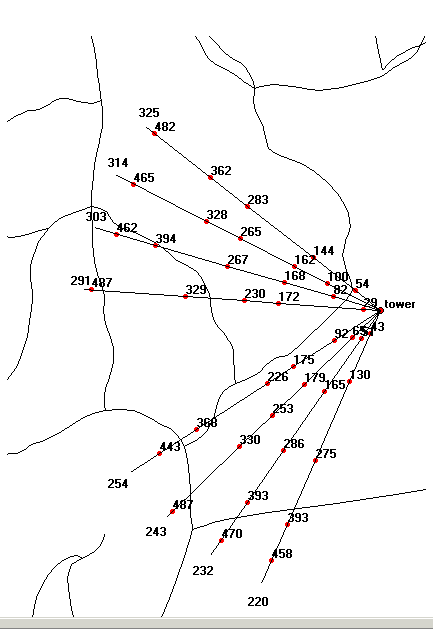
- hf069-21: compass distance map
- hf069-22: allometric equations and species names
Overview
- Lead: Jaclyn Matthes, William Munger, Steven Wofsy
- Investigators: Carol Barford, David Bryant, Victoria Chow, Daniel Curran, Evan Goldman, Elizabeth Hammond-Pyle, Naomi Hegwood, Lucy Hutyra, Christine Jones, Kathryn McKain, Leland Werden, Timothy Whitby
- Contact: Information Manager
- Start date: 1993
- End date: 2025
- Status: ongoing
- Location: Prospect Hill Tract (Harvard Forest)
- Latitude: +42.54 degrees
- Longitude: -72.17 degrees
- Elevation: 340 meter
- Datum: WGS84
- Taxa: Acer rubrum (red maple), Acer pensylvanicum (striped maple), Betula alleghaniensis (yellow birch), Betula lenta (black birch), Betula papyrifera (paper birch), Betula populifolia (gray birch), Fagus grandifolia (american beech), Fraxinus americana (white ash), Hamamelis virginiana (witch hazel), Picea glauca (white spruce), Pinus resinosa (red pine), Pinus strobus (white pine), Prunus serotina (black cherry), Quercus alba (white oak), Quercus rubra (northern red oak), Quercus velutina (black oak), Tsuga canadensis (eastern hemlock)
- Release date: 2026
- Language: English
- EML file: knb-lter-hfr.69.45
- DOI: digital object identifier
- EDI: data package
- DataONE: data package
- Related links:
- Project Website
- Canopy-Atmosphere Exchange of Carbon, Water and Energy at Harvard Forest EMS Tower since 1991
- Study type: long-term measurement
- Research topic: large experiments and permanent plot studies
- LTER core area: primary production
- Keywords: biomass, carbon dioxide, coarse woody debris, litter, soil moisture, soil respiration
- Abstract:
In 1993, we installed 40 circular, 10 m radius biometric plots in the footprint of the EMS tower on Prospect Hill. We randomly placed the plots within 100 m increments along ten 500 m transects that extend from the tower in the northwest and southwest directions. In 2001, we removed three plots (G3, H3, H4) from the datasets and ceased measurements there due to their inundation by a beaver pond. In 1999, we installed 6 additional circular, 10 m radius biometric plots on the Simes Lot, adjacent to Prospect Hill to study the effects of a selective harvest that occurred there in the winter of 2000-01. In the summer of 2001, we expanded the harvested plots in size to 15 m radius and ceased measurements at one plot (X4) because it was unaffected by the harvest. The harvest also affected three of the original tower plots (A4, A5, B5), which were expanded in size as a part of the harvest plot group. Consequently, there are 34 tower plots and 8 harvest plots. We have taken the following ecological measurements at each site: tree growth, woody debris, litter, leaf area increment (LAI), leaf chemistry, and soil respiration and moisture.
- Methods:
LAI
Leaf area index (LAI) data was collected at the biometric plots of the EMS site in 1998, 1999, and every year starting in 2005.
An LAI2000 sensor was used to make 5 measurements at each plot: one at the center, and four more at points 2 meters away from the center, in the 4 cardinal directions (N,E,S,W). All measurements were made near sunrise or sunset for diffuse light conditions. Plot-based LAI values were calculated using the standard methods of the LiCor program C2000. LAI values were calculated by averaging the 5 subplot values for each plot, and by masking the outer ring of the sensor (ring 5) so as to block out possible sunspots which may have hit the outer ring as the sun rose up from the horizon. In 2015 a new LiCOR LAI2200 sensor was purchased to replace the previous model, but comparisons between the two sensors showed consistent agreement.
Measurements are currently taken bi-weekly in spring and fall to capture the changing LAI conditions during leaf-out and senesce respectively. During mid-summer, measurements are taken on a monthly basis, since LAI is relatively stable.
Leaf Chemistry
Foliar chemistry data was collected from green canopy leaf samples in summers of 1998-2000, and 2006-2017 annually at the Harvard Forest EMS biometric plots. Green leaf samples were collected by shooting them down from the canopy with a shotgun. Samples were dried at 65 degrees C for 3 days, ground to a fine powder using a ball mill, and analyzed at the Harvard Forest on a Fison Nitrogen Analyzer NA 1500 in for the 1998-2000 samples and on an Elementar Vario Micro CHNS analyzer in for the 2006-2014 samples. Most recent C and N analyses were performed by the Laboratory of Adrien Finzi at Boston University.
Litter has been collected, dried, and weighed annually at all plots since 1998. A portion of the collected leaves, fruits and flowers, and wood pieces from 1998, 1999, and 2000 were analyzed for N and C content following the same methods above.
Litterfall
Three baskets with a radial area of 0.13 m^2 were randomly placed in each plot at the EMS tower footprint and Harvested sites. Litter collection began at the EMS site (plots A-H, 1-5) in 1998 and the Harvested site (plots X 1-6) in 1999.
Each year litter was collected throughout the fall and once the following spring, dried and weighed. Each spring's measurement is included in the previous year's dataset.
The litter was sorted in the following ways:
1998-1999: Leaf litter was sorted by tree species. The unknown category refers to leaf litter from unidentified species, including leaves that we too fragmented or decayed to be identified. EMS data from 1999 onward excludes the harvested plots (A4, A5, B5), and from 2000 onward, excludes plots lost to a swamp (G4, H3, H4). There was no spring collection in 1999. Rather, the first collection of that year was in mid-August. We estimated that 30% of the total litter collected on doy.229, 1999 fell over the winter and was thus summed as part of the 1998 data and 70% of the total litter collected on doy.229 fell during the summer and was thus included in 1999 annual sum.
2000-2003: Litter was sorted by leaf species, fruits, flowers, buds, and twigs and barks. Measurements in the Harvested plot, X4, were discontinued after 2001 because it was unaffected by the harvest.
2004: Litter was sorted by leaves (including needles), and non-leaves (including twigs, bark, fruits, flowers, buds, etc.).
2005: Litter was sorted by leaves (including needles), twigs and bark, acorns, and (non-acorn) fruits, flowers, and buds.
2006: Litter was sorted by leaf species, fruits, flowers, and buds, and twigs and barks. "Decomposed matter" was included in the "unknown" category when litter mass was calculated.
In the summer of 2006, baskets were repaired and mesh was replaced with that of a finer gauge where necessary. The random placement of the baskets in plot G4 was redone because they appeared to have been non-randomly moved to the driest portion of the plot to avoid flooding from adjacent beaver pond.
2008: Litter was sorted by leaf species, fruits, flowers, buds, twigs and barks and conifer cones. Decomposed matter was sorted as a component of the "unknown" category and all oak species were included in the same category. Because of the December 2008 Ice Storm there was a large pulse of woody material to the forest floor that would not have usually fallen. Therefore all of the woody material was removed from day.498 for comparison to other years.
2009: Litter was sorted by leaf species, fruits, flowers, buds, twigs and barks and conifer cones. Decomposed matter was sorted as a component of the "unknown" category and all oak species were included in the same category.
2010: Litter was sorted by leaf species, fruits, flowers, buds, twigs and barks and conifer cones. Decomposed matter was sorted as a component of the "unknown" category and all oak species were included in the same category. There was no litter data from 2010 in plot G4, presumably because the site was waterlogged.
2012: Some of the samples collected on 9/21/12 were not dried completely when stored. As a result many of the paper bags ripped and spilled litter into the garbage bag holding them all. In January 2013 when this problem was noticed some of the samples were moist and partly decomposed, but there was not much visible fungus. The samples from this collection date were all re-dried and re-bagged. The moist samples were from plots: A1, B1, C1, D1, E1, E2, E3, E4, E5, F1, F2, F3, F4, F5, G1, G2, G4, G5, H1, H2, and H5.
The spilled litter at the bottom of the large plastic bag was combined into a new paper bag and labeled as "mixed plots" since it was not entirely clear which plots the litter came from. Additionally four of the sample bags had been ripped such that the original labels on them could not be read, and thus we can't be sure which plots those litter samples came from. By process of elimination, those unreadable sites were: A1, C1, G2, and G4. Based on the contents of the bags, we can assign the most likely plot identity based on the plots’ previous species composition in September collection dates. C1 is mostly composed of oak. G2 has a lot of hemlock. G4 contains fern leaves. Therefore the last remaining bag is most likely A1.These samples were relabeled according to this logic, and are referred to as “partial” plots. The other samples collected on this day were kept in a different garbage bag and seemed dry, but were re-dried nonetheless.
The weights from the "mixed plots" litter was systematically re-assigned into the “partial” plots where that species was found historically. The actual weight reassigned to a given plot was proportional to its contribution to the total species weight in partial plots over the previous three years’ September collections. Small amounts (less than 0.1 g) of spruce and red pine needles in mixed litter that were not historically present in the partial plots were excluded from the corrected data set because of uncertain origin.
Total litter mass has not been calculated for 2017 to present. It will be included when available.
Missing replicates: At some points in the litter collection, plots and baskets were missed: doy.229 1999: plots B1, C2, and E1 contained birds' nests that had been built in the traps, which thus contained materials that had not fallen directly from the canopy into the baskets. doy.229 and 531 1999: Out of all the Bradys, only the plots A4, A5, and B5 were visited. From doy.299, 2001 through 2005, X1 only had two baskets. On doy.250 2001 there was one less basket in the EMS site. In 2003 H1 only had two baskets. From 2004-05 B2 only had two baskets. 4/23/07: X1 had 1 basket, A5 had 2 baskets, C2 had 2 baskets, all b/c some baskets had been blown over. 2010 - G4 wasn't sampled this year. In 2012, the following baskets and dates only had 2 baskets: B3 on 10/23/12 and 11/20/12; D1 on 10/23/12, 11/20/12, and 04/30/13; and H5 on 11/20/12.
All of these exceptions were taken into account when calculating annual sums.
Site level calculations of productivity: Plots A4, A5, B5, G3, H3, H4 are excluded from all calculations for the EMS site, and the plot X4 is excluded from all calculations for the Harvested site, although they remain in the raw data for years when measurements were taken there.
Litter Decomposition
During the first week of December, 2001, mesh bags (w/ a 1 square mm mesh size) containing oak, maple, and beech leaves were set out on the ground in five plots.
The litter samples were oven dried, but then sat on a shelf before they were weighed again and put out for this particular study. Therefore, any moisture the leaf samples may have accumulated between when they were oven dried and when they were weighed is accounted for in the processing.
Samples were collected on several dates over the following years. Eventually, the bags accumulated too much dirt and roots growing through them that the leaves could not be separated for weighing. This was the case for the samples that have no end weight recorded.
Two samples, B5 24 and B3 74, gained weight over the time period that they were outside, which means there was either a mistake in collecting or recording the data, or the mesh bags actually gained material while they were outside that was not part of the original sample. These samples were removed from the data in the processing.
Soil Moisture
Two TDR probes were located at each plot where soil respiration was measured. Many more measurements were made at the cut-site plots than the EMS plots in the early years because the primary goal at that time was to track a potential change in soil moisture due to the selective harvest that occurred in 2001.
Two different instruments were used to generate the TDR waveforms. For 1999-2001 a Tektronix cable tester (1502B TDR) was used and in 2002-03 a soil moisture system by Campbell Scientific (TDR100 and CS605 probes) was used. To calculate a diaelectric constant (Ka) from each waveform, we used an automated script which first applied a Savitsky-Golay filter to the waveform data and then used a tangent-line method to locate the two inflection points.
Soil Respiration
Soil respiration was measured throughout the growing season in 1998-2000, 2002-2003, and once in 2006. It was measured in 9 plots in EMS tower footprint (B3, B4, C3, D5, E3, G3, H3, H4, G5) and in 9 plots on the adjacent harvest site (A4, A5, B5, X1-X6). See the plot map for plot locations. There are 5 permanently installed soil collars in each plot. Each collar has a unique number, 1-90. Plots for measuring soil respiration in the EMS tower footprint were chosen to be distributed across a range of soil drainage classes - 3 poorly-drained sites, 3 moderately drained sites, and 3 well-drained sites. The 3 poorly drained plots (G3, H3, H4) were inundated with water from a beaver pond and measurements ceased there in 2001. Measurements at the cut site began in 1999 and a selective harvest occurred on the site in 2001. Measurements at plot X4 ceased in 2001 because the plot was unaffected by the harvest.
Respiration was measured using a portable soil pack with a LICOR 6252 in a closed chamber system. CO2 was recorded every 5 seconds for between 3.5 and 4.5 min. In 1998, some of the measurements were made at night, after 6pm.
Soil CO2 flux was calculated assuming a cylindrical chamber, negligible volume in the sample flow lines and LiCOR cells, and a constant air pressure. Chamber height was taken as the sum of the chamber top (11.3 cm) and the average height of individual collars, as measured in the field. Soil and air temperatures were measured in the field at the time of each soil respiration measurement. Air temperature data was filled with half hourly air temperature data measured at a height of 2.5 m on the EMS tower.
To estimate the slope of the CO2 vs. t curve, we first smoothed the curve with a Savitsky-Golay filter, and then took the mean and standard deviation of the first derivative where it flattened out at the back side of the curve. The portion of the first derivative that was used in the calculation was selected by hand for each individual curve. If the first derivative never flattened out, a soil flux was not calculated. Soil fluxes were also not calculated for curves where the relative standard deviation of the first derivative was greater than 1. The mean and standard deviation of the first derivative of each curve, along with the number of points used to calculate them, are printed with the flux data, giving the user of the data the option of filtering the data with more or less rigorous standards.
Trees
All live trees greater than or equal to 10 cm DBH were measured in the tower plots and greater than or equal to 5 cm DBH in the harvested plots. Each tree's DBH (cm) was calculated from measurements of their dendrometer's expansion (or contraction) (mm), which were taken with digital calipers. To minimize discontinuity in any tree’s DBH when dendrometer bands are replaced, or new reference DBH tape measurements were taken, we now calculate DBH by applying each reference DBH tape to the entire dendrometer record, and then taking the median value. Species specific allometric equations were used to calculate each tree's weight (kg) from their DBH (not including leaves). Each tree's carbon content was assumed to be one half of its weight. The trees' weights in C were summed at the site level to yield aboveground woody biomass (AGWB) and growth increment (AGWI), and biomass lost to mortality and gained through recruitment, all in MgC/ha/yr, for each year and site. We define AGWI as the sum of the difference in current year maximum AGWB and previous year maximum AGWB, not including new recruits or deceased trees. Net primary production (ANPP) was calculated as AGWI + the sum of the increment of ingrowth + the sum of fine litter fall using the methods described in Clark et al. 2001. Ingrowth is defined as the difference in AGWB of new recruits and the Biomass of a conspecific tree with the threshold DBH of 10 cm. Note that measurements for years 1994-1998 at the tower site represent multi-year averages.
The understory data includes saplings and shrubs greater than or equal to 1 cm DBH and less than 10 cm DBH at the tower plots and less than 5 cm DBH at the harvested plots. When comparing years, please note that the most recent survey in 2017 used a different lower threshold of greater than or equal to 2.5 cm DBH to reduce sampling time. Saplings and shrubs were measured in the EMS tower plots in November 2004, 2006, 2010, and 2017; in the harvested plots in early June and November 2006, and June 2017. Diameters were measured with digital calipers and recorded in centimeters. For the 2004 survey, trees were measured in 1 cm increments (labeled “dbh.class” i.e. greater than or equal to 1 to less than 2, greater than or equal to 2 to less than 3, etc.) and the number of trees in each plot, species, and size group were tallied in the column labelled "nindivs". For the latter surveys, all stem measurements were listed individually by caliper or DBH tape in 2017. For ease of comparison, individual DBH observations are also binned and reported in the “dbh.class” and “nindivs” format. Please do not double count these data. Lastly, yellow and black birch trees are difficult to tell apart in the sapling stage, and they should be considered interchangeable in the understory data. In the summary data for understory trees, site level means (based on plots) and their confidence intervals are reported in bins based on dbh sizes. Since the understory survey for 2017 did not have trees between 1 and 2.5 cm, the size bins are not the same in every year.
Woody Debris
Coarse woody debris (CWD) is all pieces greater than or equal to 7.5 cm diameter. CWD surveys involved measuring all fallen logs, stumps, standing snags, and whole dead trees in our biometric plots in the footprint of the EMS tower and at our cut site on the Simes Trust land. In 2016 and 2017, methods were transitioned to the line transect method from Harmon and Sexton 1996, which gives the following formula for calculating volume per unit area (m^3*m^-2): V=9.869 * sum(d^2/8*L), where d is he piece diameter in m and L is the total transect length in m. Each EMS plot had three 10 m transects from plot center to perimeter at 0, 120, and 240 degrees declination. Harvest plot transects were 15m long to match its plot size.
Fine woody debris (FWD) was also measured using the line intercept method. However for FWD, line transects were randomly placed in different locations across the tract of land for each survey and every other 10 m segment on the transect was surveyed for FWD. FWD is all pieces greater than or equal to 2 cm in diameter and less than 7.5 cm in diameter.
Annual means and 95% confidence intervals (where plots and segments are the unit of measurement) of volume and biomass are summarized in the files labeled "summary". Biomass was calculated from volumes using decay-class specific densities from Liu et al 2006. For CWD pieces categorized as whole tree snags, biomass was calculated using species-specific allometric equations for live trees, which are listed for our live tree data. Volumes of whole tree snags were calculated from biomass estimates using the inverse of Liu et al's densities.
Soil Water Content
Permanent soil moisture sensors were installed in late 2006 and continuously processed data are available since 13 June 2017.
The soil layers in the Soil Moisture Pit in November 2006 were: 0 to 5 cm - rich organic layer; 5 to 20 cm - light brown organic; 20 to 45 cm - red oxic layer; deeper than 45 cm - light brown / grey, silt.
Two pits were dug to contain a profile of soil moisture and soil temperature measurements. The first pit was dug 15 meters north of the EMS shack. The second pit was dug 15 meters to the southeast from the shack. The two pits were on opposite sides of a small ridge, which separated their drainage. The first pit was noticeably drier than the second pit, whose water table was reached at 1 meter deep. It should be noted that the second pit was near an intermittent stream bed.
TDR probes (Campbell Sci CS616) and thermistors were placed at the following depths: 90 cm -bottom of hole; 50 cm -interface between grey and red layers; 40 cm - middle of red layer; 15 cm - middle of organic layer.
In July 2017 new holes were dug next to the existing sensors in order to install a new set of soil moisture/temperature probes to replace the sensors that were degrading. Data from 2007-06-13 to2017-07-26 were measured with CS616 probes. Data since 2017-07-21 was measured with Campbell CS655 probes.
References:
Harmon ME and Sexton J. 1996. Guidelines for measurements of woody detritus in forest ecosystems. Publication No. 20. U.S. LTER Network Office: University of Washington, Seattle, WA, USA. 73 pp.
Liu WH, Bryant DM, Hutyra LR, Saleska SR, Hammond-Pyle E, Curran D, Wofsy SC. 2006. Woody debris contribution to the carbon budget of selectively logged and maturing mid-latitude forest. Oecologia 108(1): 108-117.
- Organization: Harvard Forest. 324 North Main Street, Petersham, MA 01366, USA. Phone (978) 724-3302. Fax (978) 724-3595.
- Project: The Harvard Forest Long-Term Ecological Research (LTER) program examines ecological dynamics in the New England region resulting from natural disturbances, environmental change, and human impacts. (ROR).
- Funding: National Science Foundation LTER grants: DEB-8811764, DEB-9411975, DEB-0080592, DEB-0620443, DEB-1237491, DEB-1832210.
- Use: This dataset is released to the public under Creative Commons CC0 1.0 (No Rights Reserved). Please keep the dataset creators informed of any plans to use the dataset. Consultation with the original investigators is strongly encouraged. Publications and data products that make use of the dataset should include proper acknowledgement.
- License: Creative Commons Zero v1.0 Universal (CC0-1.0)
- Citation: Matthes J, Munger W, Wofsy S. 2026. Biomass Inventories at Harvard Forest EMS Tower since 1993. Harvard Forest Data Archive: HF069 (v.45). Environmental Data Initiative: https://doi.org/10.6073/pasta/e701fd0fc27f84f4379772abed09276c.
Detailed Metadata
hf069-01: LAI plot-level
- date: date
- year: year
- doy: Julian day (unit: nominalDay / missing value: NA)
- plot: plot
- lai: leaf area index (unit: dimensionless / missing value: NA)
- se: standard error of leaf area index (unit: dimensionless / missing value: NA)
hf069-02: LAI site-level
- date: date
- year: year
- doy: Julian day (unit: nominalDay / missing value: NA)
- site: site
- ems: EMS tower footprint site
- cut: selectively harvested site
- n_plots: quality flag that shows where our LAI is calculated using data from all of our plots and where it is calculated using some subset of the plots
- all_mean: mean for each plot and Julian day of measurement. The data reported in this file is of plant area index (PAI), and has not been corrected for woody material. (unit: meterSquaredPerMeterSquared / missing value: NA)
- all_stdev: standard deviation for each plot and Julian day of measurement. The data reported in this file is of plant area index (PAI), and has not been corrected for woody material. (unit: meterSquaredPerMeterSquared / missing value: NA)
- all_conf_int: 95% percent confident intervals (unit: meterSquaredPerMeterSquared / missing value: NA)
- decid_mean: mean deciduous LAI (unit: meterSquaredPerMeterSquared / missing value: NA)
- decid_stdev: deciduous LAI standard deviation (unit: meterSquaredPerMeterSquared / missing value: NA)
- decid_conf_int: deciduous LAI 95% confidence intervals (unit: meterSquaredPerMeterSquared / missing value: NA)
hf069-03: litter chemistry
- date: date
- year: year
- doy: Julian day (unit: nominalDay / missing value: NA)
- plot: plot
- species: species. See the allometries file for a key of species abbreviations.
- n_per: percent nitrogen (unit: dimensionless / missing value: NA)
- c_per: percent carbon (unit: dimensionless / missing value: NA)
hf069-04: canopy chemistry
- date: sample date
- year: year
- plot: plot
- tag: tree tag number
- species: species. See the allometries file for a key of species abbreviations.
- sample_number: sample number (unit: number / missing value: NA)
- n_per: percent nitrogen (unit: dimensionless / missing value: NA)
- c_per: percent carbon (unit: dimensionless / missing value: NA)
- vial_label: vial label
hf069-05: litterfall
- year: year leaves were produced
- doy: day of collection (values higher than 366 indicate that the leaves were collected the following year) (unit: nominalDay / missing value: NA)
- date: date of collection
- site: site
- ems: EMS tower footprint site
- harv: selectively harvested site
- plot: plot
- spp: species. See the allometries file for a key of species abbreviations.
- wt_g: weight (unit: gram / missing value: NA)
hf069-06: litter decomposition
- species: species. See the allometries file for a key of species abbreviations.
- tag: tag number
- plot: plot. Whereas the first four plots are located in the Simes Trust land, which was cut in the winter of 2000/2001, the control plot, B3, is located on Prospect Hill in the EMS tower footprint, just across the road from the cut site. The upland and lowland descriptions refer to the rocky topography of the plot and whether the bags were in a low or high spot.
- A5: heavy cut, edge of skidtrail
- B5: heavy cut, edge of skidtrail, light/moderate cut
- X2: light/moderate cut, light skidtrail
- X1: heavy skidtrail
- B3: upland, lowland
- NA: NA
- skid: whether the sample was in a skid area
- 1: skid trail
- 0: no skid trail
- NA: NA
- cut: whether it was in an area that had been moderately or heavily cut
- 1: heavily cut
- 0: moderately cut
- NA: NA
- up_low: upland or lowland, refers only to samples in the control plot
- 1: upland
- 0: lowland
- NA: NA
- year: end year
- doy: end day of year (unit: nominalDay / missing value: NA)
- date: end date
- start_weight: start weight (unit: gram / missing value: NA)
- end_weight: end weight (unit: gram / missing value: NA)
hf069-07: soil moisture
- date: date
- plot_probe: plot and probe number for unique identification of each probe
- ka: dialectric constant calculated from each TDR waveform (unit: number / missing value: NA)
- wc: water content calculated using Topp's equation (Topp et al. 1980) (unit: cubicCentimetersPerCubicCentimeters / missing value: NA)
hf069-08: soil respiration
- datetime: date and time
- date: date
- doy: Julian day (unit: nominalDay / missing value: NA)
- time: time
- plot: plot
- collar: collar number (1-90)
- range_min: minimum CO2 concentration measured (ppm) (unit: dimensionless / missing value: NA)
- range_max: final [maximum] CO2 concentration measured (ppm) (unit: dimensionless / missing value: NA)
- x_cutoff: time (s) on the curve after which the mean of the 1st derivative was calculated (unit: second / missing value: NA)
- mean_slope: mean of the 1st derivative (ppm/s) (unit: dimensionless / missing value: NA)
- stdev_slope: standard deviation of the 1st derivative (ppm/s) (unit: dimensionless / missing value: NA)
- n_pts: N points used to calculate the mean of the 1st derivative (unit: number / missing value: NA)
- flag_stdev: flag for when the relative standard deviation > 1
- tair: air temperature (unit: celsius / missing value: NA)
- tsoil: soil temperature (unit: celsius / missing value: NA)
- collar_height: average collar height (unit: meter / missing value: NA)
- flux: soil CO2 flux (micromole CO2/m2/s) (unit: micromolePerMeterSquaredPerSecond / missing value: NA)
hf069-09: EMS plots tree summary
- date: date
- year: year
- doy: Julian day (unit: nominalDay / missing value: NA)
- tree_type: tree type
- live: live
- dead: dead
- recruit: recruited
- plot: plot
- plottag: plot tag
- species: species. See the allometries file for a key of species abbreviations.
- dbh_cm: diameter at breast height taken with digital calipers (unit: centimeter / missing value: NA)
- biomass_kgc: biomass as calculated from the equations contained in the allometries file (unit: kilogram / missing value: NA)
- basal_area_cm2: basal area (unit: squareCentimeters / missing value: NA)
hf069-10: harvest plot tree summary
- date: date
- year: year
- doy: Julian day (unit: nominalDay / missing value: NA)
- tree_type: tree type
- live: live
- dead: dead
- recruit: recruited
- plot: plot
- plottag: plot tag
- species: species. See the allometries file for a key of species abbreviations.
- dbh_cm: diameter at breast height taken with digital calipers (unit: centimeter / missing value: NA)
- biomass_kgc: biomass as calculated from the equations contained in the allometries file (unit: kilogram / missing value: NA)
- basal_area_cm2: basal area (unit: squareCentimeters / missing value: NA)
hf069-11: understory tree summary
- date: date
- year: year
- doy: Julian day (unit: nominalDay / missing value: NA)
- tree_type: tree type
- und: understory
- site: site
- harv: selectively harvested site
- ems: EMS tower footprint site
- plot: plot
- nindivs: tally of the number of trees in each plot, species, and size group (unit: number / missing value: NA)
- species: species. See the allometries file for a key of species abbreviations.
- dbh_cm: diameter at breast height taken with digital calipers (unit: centimeter / missing value: NA)
- biomass_kgc: biomass as calculated from the equations contained in the allometries file (unit: kilogram / missing value: NA)
- basal_area_cm2: basal area (unit: squareCentimeters / missing value: NA)
hf069-12: biomass and basal area summary
- year: year
- plot: plot
- species: species. See the allometries file for a key of species abbreviations.
- biomass_kgc: biomass as calculated from the equations contained in the allometries file (unit: kilogram / missing value: NA)
- basal_area_m2_ha: basal area (unit: meterSquaredPerHectare / missing value: NA)
hf069-13: coarse woody debris
- site: grouping of plots
- harv: site south of the EMS sites where a partial timber harvest took place in 2001
- ems: EMS tower footprint site, arrayed in transects radiating from the flux tower in the prevailing wind directions
- year: year of data collection
- method: type of field measurement (see Harmon and Sexton)
- harvfixed.area: full survey within the perimeter of the plot
- transect: three transects the length of the plot radius for downed CWD in 2016 and 2017
- plot: location of data collection
- tag: number identifying the piece of CWD. Corresponds with aluminum tag in field. If tag could not be found in re-survey, NA was recorded. 6-digit numbers correspond to megaplot tags.
- spp: abbreviation for species name or coarser level of identification
- rm: red maple
- unk: unknown
- ro: red oak
- hw: hardwood
- yb: yellow beech
- wp: white pine
- hem: hemlock
- bb: black birch
- gb: gray birch
- conifer: conifer
- wb: white birch
- rp: red pine
- wh: witch hazel
- chestnut: chestnut
- sm: striped maple
- birch: birch species
- hemlock: hemlock
- cherry: cherry
- ws: white spruce
- ash: white ash
- wo: white oak
- maple: maple species
- oak: oak species
- type: pool of coarse wood based on position in the plot
- l.snag: log snag - standing boles taller than 1.3 m
- log: fallen snags in contact with the ground
- stump: log snags under 1.3 m tall
- w.snag: whole snags - recently dead trees with intact branches
- length_m: length along an axis of bole (unit: meter / missing value: NA)
- base_d: diameter of the base of CWD (unit: centimeter / missing value: NA)
- mid_d: diameter at midpoint of CWD (unit: centimeter / missing value: NA)
- dbh: diameter at 1.3 m height of standing CWD (unit: centimeter / missing value: NA)
- top_d: diameter at top of standing CWD, or opposite end of downed CWD. If top diameter was too high to reach in field, it was visually estimated to the nearest cm. (unit: centimeter / missing value: NA)
- ground: percent of area downed CWD was in contact if the forest floor (unit: dimensionless / missing value: NA)
- bark: percent of surface area with bark remaining on CWD (unit: dimensionless / missing value: NA)
- phys_char: observed physical characteristics
- 1: leaves present
- 2: twigs present
- 3: branches present
- 4: bark on branches
- 5: bark on bole
- 6: sapwood sloughing
- 7: sapwood friable
- 8: heartwood friable
- 9: hollow
- biol_char: observed biological characteristics
- 1: conks
- 2: moss
- 3: lichen
- 4: termites
- 5: other bug signs
- dia_1: if method is "transect", the diameter measurement at intersection of transect tape and log (unit: centimeter / missing value: NA)
- dia_2: if method is "transect", the second diameter measurement at intersection of transect tape and log, perpendicular to the first, to get ellipsoid shape (unit: centimeter / missing value: NA)
- decay: ordinal scale of stage of decomposition assessed in field, see Harmon and Sexton 1996
- density_gcm3: bulk density in grams per cubic cm of coarse wood, based on species (or group average) values from Liu et al. 2006. (unit: gramPerMeterCubed / missing value: NA)
- vol_m3: volume of coarse wood (unit: cubicMeter / missing value: NA)
- megag_c: megagrams of carbon (unit: megagram / missing value: NA)
hf069-14: fine woody debris
- year: year
- site: site
- ems: EMS tower footprint site
- harv: selectively harvested site
- transect: transect number
- segment: segment number
- diameter: the diameter of each piece was measured in mm where it intersected the transect (unit: millimeter / missing value: NA)
- decay: a decay class 1-5 was assigned to each piece, using the same classification system as for CWD
hf069-15: understory summary
- site: site
- ems: EMS tower footprint site
- harv: selectively harvested site
- year: year of data collection
- dbh: diameter at breast height nominal grouping
- 1to5: greater than or equal to 1 cm and less than 5 cm
- 5to10: greater than or equal to 5 cm and less than 10 cm
- 1to10: greater than or equal to 1 cm and less than 10 cm
- 2.5to5: greater than or equal to 2.5 cm and less than 5 cm
- 2.5to10: greater than or equal to 2.5 cm and less than 10 cm
- n_plots: number of plots surveyed to calculate site average, 10 m radius for EMS, 15m radius for harvest plots (unit: number / missing value: NA)
- agwb_mgc_ha: plot average understory tree above-ground woody biomass (AGWB) in megagrams of carbon per hectare (unit: megagramPerHectare / missing value: NA)
- agwb_mgc_ha_se: standard error of AGWB (unit: dimensionless / missing value: NA)
- agwb_mgc_ha_ci: 95% percent confident interval of AGWB (unit: dimensionless / missing value: NA)
- ba_m2_ha: plot average understory tree basal area (BA) in meters2 per hectare (unit: meterSquaredPerHectare / missing value: NA)
- ba_m2_ha_se: standard error of BA (unit: dimensionless / missing value: NA)
- ba_m2_ha_ci: 95% percent confident interval of BA (unit: dimensionless / missing value: NA)
- trees_ha: number of tree stems per hectare (unit: number / missing value: NA)
- trees_ha_se: standard error of tree stems per hectare (unit: dimensionless / missing value: NA)
- trees_ha_ci: 95% confidence interval of tree stems per hectare (unit: dimensionless / missing value: NA)
hf069-16: EMS plots annual summary
- year: year
- site: site
- ems: EMS tower footprint site
- agwi: aboveground woody increment (unit: megagramPerHectarePerYear / missing value: NA)
- agwb: aboveground woody biomass (unit: megagramPerHectarePerYear / missing value: NA)
- recruit: biomass gained through recruitment (unit: megagramPerHectarePerYear / missing value: NA)
- mortality: biomass lost to mortality (unit: megagramPerHectarePerYear / missing value: NA)
- anpp: net primary production. calculated as the sum of the increment of surving trees (AGWI) + the sum of the increment of ingrowth + the sum of fine litterfall using the methods described in Clark et al. 2001. (unit: megagramPerHectarePerYear / missing value: NA)
hf069-17: harvest plots annual summary
- year: year
- site: site
- harv: selectively harvested site
- agwi: aboveground woody increment (unit: megagramPerHectarePerYear / missing value: NA)
- agwb: aboveground woody biomass (unit: megagramPerHectarePerYear / missing value: NA)
- recruit: biomass gained through recruitment (unit: megagramPerHectarePerYear / missing value: NA)
- mortality: biomass lost to mortality (unit: megagramPerHectarePerYear / missing value: NA)
- anpp: net primary production. calculated as the sum of the increment of surving trees (AGWI) + the sum of the increment of ingrowth + the sum of fine litterfall using the methods described in Clark et al. 2001. (unit: megagramPerHectarePerYear / missing value: NA)
hf069-18: soil temperature and water content 2007-2017
- Time_EST: datetime at start of measurement interval
- year: year
- doy: day of year (unit: dimensionless / missing value: NA)
- temp_15_a: soil temperature at 15cm in Pit A on north side of EMS shed (unit: celsius / missing value: NA)
- temp_40_a: soil temperature at 40cm in Pit A on north side of EMS shed (unit: celsius / missing value: NA)
- temp_50_a: soil temperature at 50cm in Pit A on north side of EMS shed (unit: celsius / missing value: NA)
- temp_90_a: soil temperature at 90cm in Pit A on north side of EMS shed (unit: celsius / missing value: NA)
- temp_15_b: soil temperature at 15cm in Pit B on southeast side of EMS shed (unit: celsius / missing value: NA)
- temp_40_b: soil temperature at 40cm in Pit B on southeast side of EMS shed (unit: celsius / missing value: NA)
- temp_50_b: soil temperature at 50cm in Pit B on southeast side of EMS shed (unit: celsius / missing value: NA)
- temp_90_b: soil temperature at 90cm in Pit B on southeast side of EMS shed (unit: celsius / missing value: NA)
- vwc_15_a: soil water content at 15cm in Pit A on north side of EMS shed (unit: dimensionless / missing value: NA)
- vwc_40_a: soil water content at 40cm in Pit A on north side of EMS shed (unit: dimensionless / missing value: NA)
- vwc_50_a: soil water content at 50cm in Pit A on north side of EMS shed (unit: dimensionless / missing value: NA)
- vwc_90_a: soil water content at 90cm in Pit A on north side of EMS shed (unit: dimensionless / missing value: NA)
- vwc_15_b: soil water content at 15cm in Pit B on southeast side of EMS shed (unit: dimensionless / missing value: NA)
- vwc_40_b: soil water content at 40cm in Pit B on southeast side of EMS shed (unit: dimensionless / missing value: NA)
- vwc_50_b: soil water content at 50cm in Pit B on southeast side of EMS shed (unit: dimensionless / missing value: NA)
- vwc_90_b: soil water content at 90cm in Pit B on southeast side of EMS shed (unit: dimensionless / missing value: NA)
hf069-19: soil temperature and water content since 2017
- Time_EST: datetime at start of measurement interval
- year: year
- doy: day of year (unit: dimensionless / missing value: NA)
- t_15cm_avg_deg_c_a: soil temperature at 15cm in Pit A on north side of EMS shed (unit: celsius / missing value: NA)
- t_35cm_avg_deg_c_a: soil temperature at 35cm in Pit A on north side of EMS shed (unit: celsius / missing value: NA)
- t_50cm_avg_deg_c_a: soil temperature at 50cm in Pit A on north side of EMS shed (unit: celsius / missing value: NA)
- t_90cm_avg_deg_c_a: soil temperature at 90cm in Pit A on north side of EMS shed (unit: celsius / missing value: NA)
- t_15cm_avg_deg_c_b: soil temperature at 15cm in Pit B on southeast side of EMS shed (unit: celsius / missing value: NA)
- t_35cm_avg_deg_c_b: soil temperature at 35cm in Pit B on southeast side of EMS shed (unit: celsius / missing value: NA)
- t_50cm_avg_deg_c_b: soil temperature at 50cm in Pit B on southeast side of EMS shed (unit: celsius / missing value: NA)
- t_90cm_avg_deg_c_b: soil temperature at 90cm in Pit B on southeast side of EMS shed (unit: celsius / missing value: NA)
- vwc_15cm_avg_m_3_m_3_a: soil water content at 15cm in Pit A on north side of EMS shed (unit: dimensionless / missing value: NA)
- vwc_35cm_avg_m_3_m_3_a: soil water content at 35cm in Pit A on north side of EMS shed (unit: dimensionless / missing value: NA)
- vwc_50cm_avg_m_3_m_3_a: soil water content at 50cm in Pit A on north side of EMS shed (unit: dimensionless / missing value: NA)
- vwc_90cm_avg_m_3_m_3_a: soil water content at 90cm in Pit A on north side of EMS shed (unit: dimensionless / missing value: NA)
- vwc_15cm_avg_m_3_m_3_b: soil water content at 15cm in Pit B on southeast side of EMS shed (unit: dimensionless / missing value: NA)
- vwc_35cm_avg_m_3_m_3_b: soil water content at 35cm in Pit B on southeast side of EMS shed (unit: dimensionless / missing value: NA)
- vwc_50cm_avg_m_3_m_3_b: soil water content at 50cm in Pit B on southeast side of EMS shed (unit: dimensionless / missing value: NA)
- vwc_90cm_avg_m_3_m_3_b: soil water content at 90cm in Pit B on southeast side of EMS shed (unit: dimensionless / missing value: NA)
hf069-20: plot map
- Compression: none
- Format: jpeg
- Type: image
hf069-21: compass distance map
- Compression: none
- Format: bmp
- Type: image
hf069-22: allometric equations and species names
- Compression: none
- Format: text
- Type: document