
You are here
Harvard Forest Data Archive
HF234
Imputed Forest Composition Map for New England Screened by Species Range Boundaries 2001-2006
Related PublicationsData
Overview
- Lead: Matthew Duveneck, Jonathan Thompson, B. Tyler Wilson
- Investigators:
- Contact: Information Manager
- Start date: 2001
- End date: 2006
- Status: complete
- Location: New England
- Latitude: +40.9 to +47.4 degrees
- Longitude: -74.0 to -66.9 degrees
- Elevation: 0 to 2000 meter
- Datum: WGS84
- Taxa:
- Release date: 2023
- Language: English
- EML file: knb-lter-hfr.234.6
- DOI: digital object identifier
- EDI: data package
- DataONE: data package
- Related links:
- Study type: long-term measurement, modeling
- Research topic: conservation and management; ecological informatics and modelling; regional studies
- LTER core area: population studies, disturbance patterns
- Keywords: forest dynamics, future scenarios, inventories, landscape, modeling, species composition
- Abstract:
Initializing forest landscape models (FLMs) to simulate changes in tree species composition requires accurate fine-scale forest attribute information mapped contiguously over large areas. Nearest-neighbor imputation maps have high potential for use as the initial condition within FLMs, but the tendency for field plots to be imputed over large geographical distances results in species frequently mapped outside of their home ranges, which is problematic. We developed an approach for evaluating and selecting field plots for imputation based on their similarity in feature-space, their species composition, and their geographical distance between source and imputation to produce a map that is appropriate for initializing an FLM. We applied this approach to map 13m ha of forest throughout the six New England states (Rhode Island, Connecticut, Massachusetts, New Hampshire, Vermont, and Maine). The map itself is a .img raster file of FIA plot CN numbers. To access FIA data from this map, one has to link the mapcodes in this map to FIA data supplied by USDA FIA database (https://apps.fs.usda.gov/fia/datamart/datamart.html). Due to plot confidentiality and integrity concerns, pixels containing FIA plots were always assigned to some other plot than the actual one found there.
- Methods:
Study Area
Our study area includes the forested areas within the six New England states in the northeastern U.S. (Rhode Island, Connecticut, Massachusetts, New Hampshire, Vermont, and Maine). Total forest cover within this 18 million hectare region exceeds 80% but ranges from 50% (Rhode Island) to 90% (Maine). The forests span a diverse ecological gradient that includes spruce-fir forests in northern Maine to oak-maple and pitch pine forests in southern New England (David R Foster and Aber, 2004; Tang and Beckage, 2010). Elevations range from sea level to nearly 2000 meters above sea level in the White Mountain Range in New Hampshire. The region experiences annual mean temperatures ranging from 3 to 10° C (mean Jan temp = -6°C; mean July temp = 19°C), and average annual precipitation from 79 to 255cm. The region was almost completely forested until the 17th C, when two centuries of logging and agricultural clearing removed more than half of the forest cover and cut-over most of the rest (D.R. Foster, 1992; Thompson, Carpenter, Cogbill, and Foster, 2013). Forest cover reached its nadir in the mid nineteenth century, after which widespread farm abandonment and population concentration initiated a century of natural reforestation and forest growth. The modern landscape reached its apex of reforestation recently and is again experiencing a slow loss of forest cover in all six states (D. R. Foster et al., 2010). Today, New England’s multiple land-uses include agriculture, forest conservation, wildlife habitat, timber harvest, water filtration, and development (Homer, Fry, and Barnes, 2012).
Nearest Neighbor Data Selection
We used an existing kNN imputation product recently developed for the eastern United States using equal weighting and a canonical correspondence analysis distance metric (Wilson et al. 2012). This process used vegetation phenology derived from MODIS imagery and spatial environmental variables to impute FIA plots to each 250-m pixel across the eastern United States. FIA plots used in this imputation were measured between 2001 and 2006. For each 250-m pixel in our study area, we assembled the first five nearest-neighbor plots (k=5). Because the original kNN imputation products were derived for all of the eastern United States, potential imputation plots (source plots) came from FIA plots collected throughout the eastern United States (Wilson et al. 2012).
We built a screened-selection map (ks) based on selecting the best field plot from the five nearest neighbors in feature-space for each 250-m pixel in our landscape as follows: Because our final map product was focused on forests rather than other land uses, we included only the map pixels classified as forest within the National Land Cover Database (NLCD 2011) (Homer et al. 2012). We then removed neighbors whose source plots did not include trees. Next, we screened out source plots that included tree species that did not match historical species range distribution (Little 1971). Of the remaining neighbors for each pixel, we choose the closest source plot based on geographic (Euclidian) distance as the first five neighbors are approximately equidistant in feature-space (Wilson et al. 2012). If none of the five neighbors remained, we selected a correctly matched source plot from the closest neighboring pixel. Due to plot confidentiality and integrity concerns, pixels containing FIA plots were always assigned to some other plot than the actual one found there.
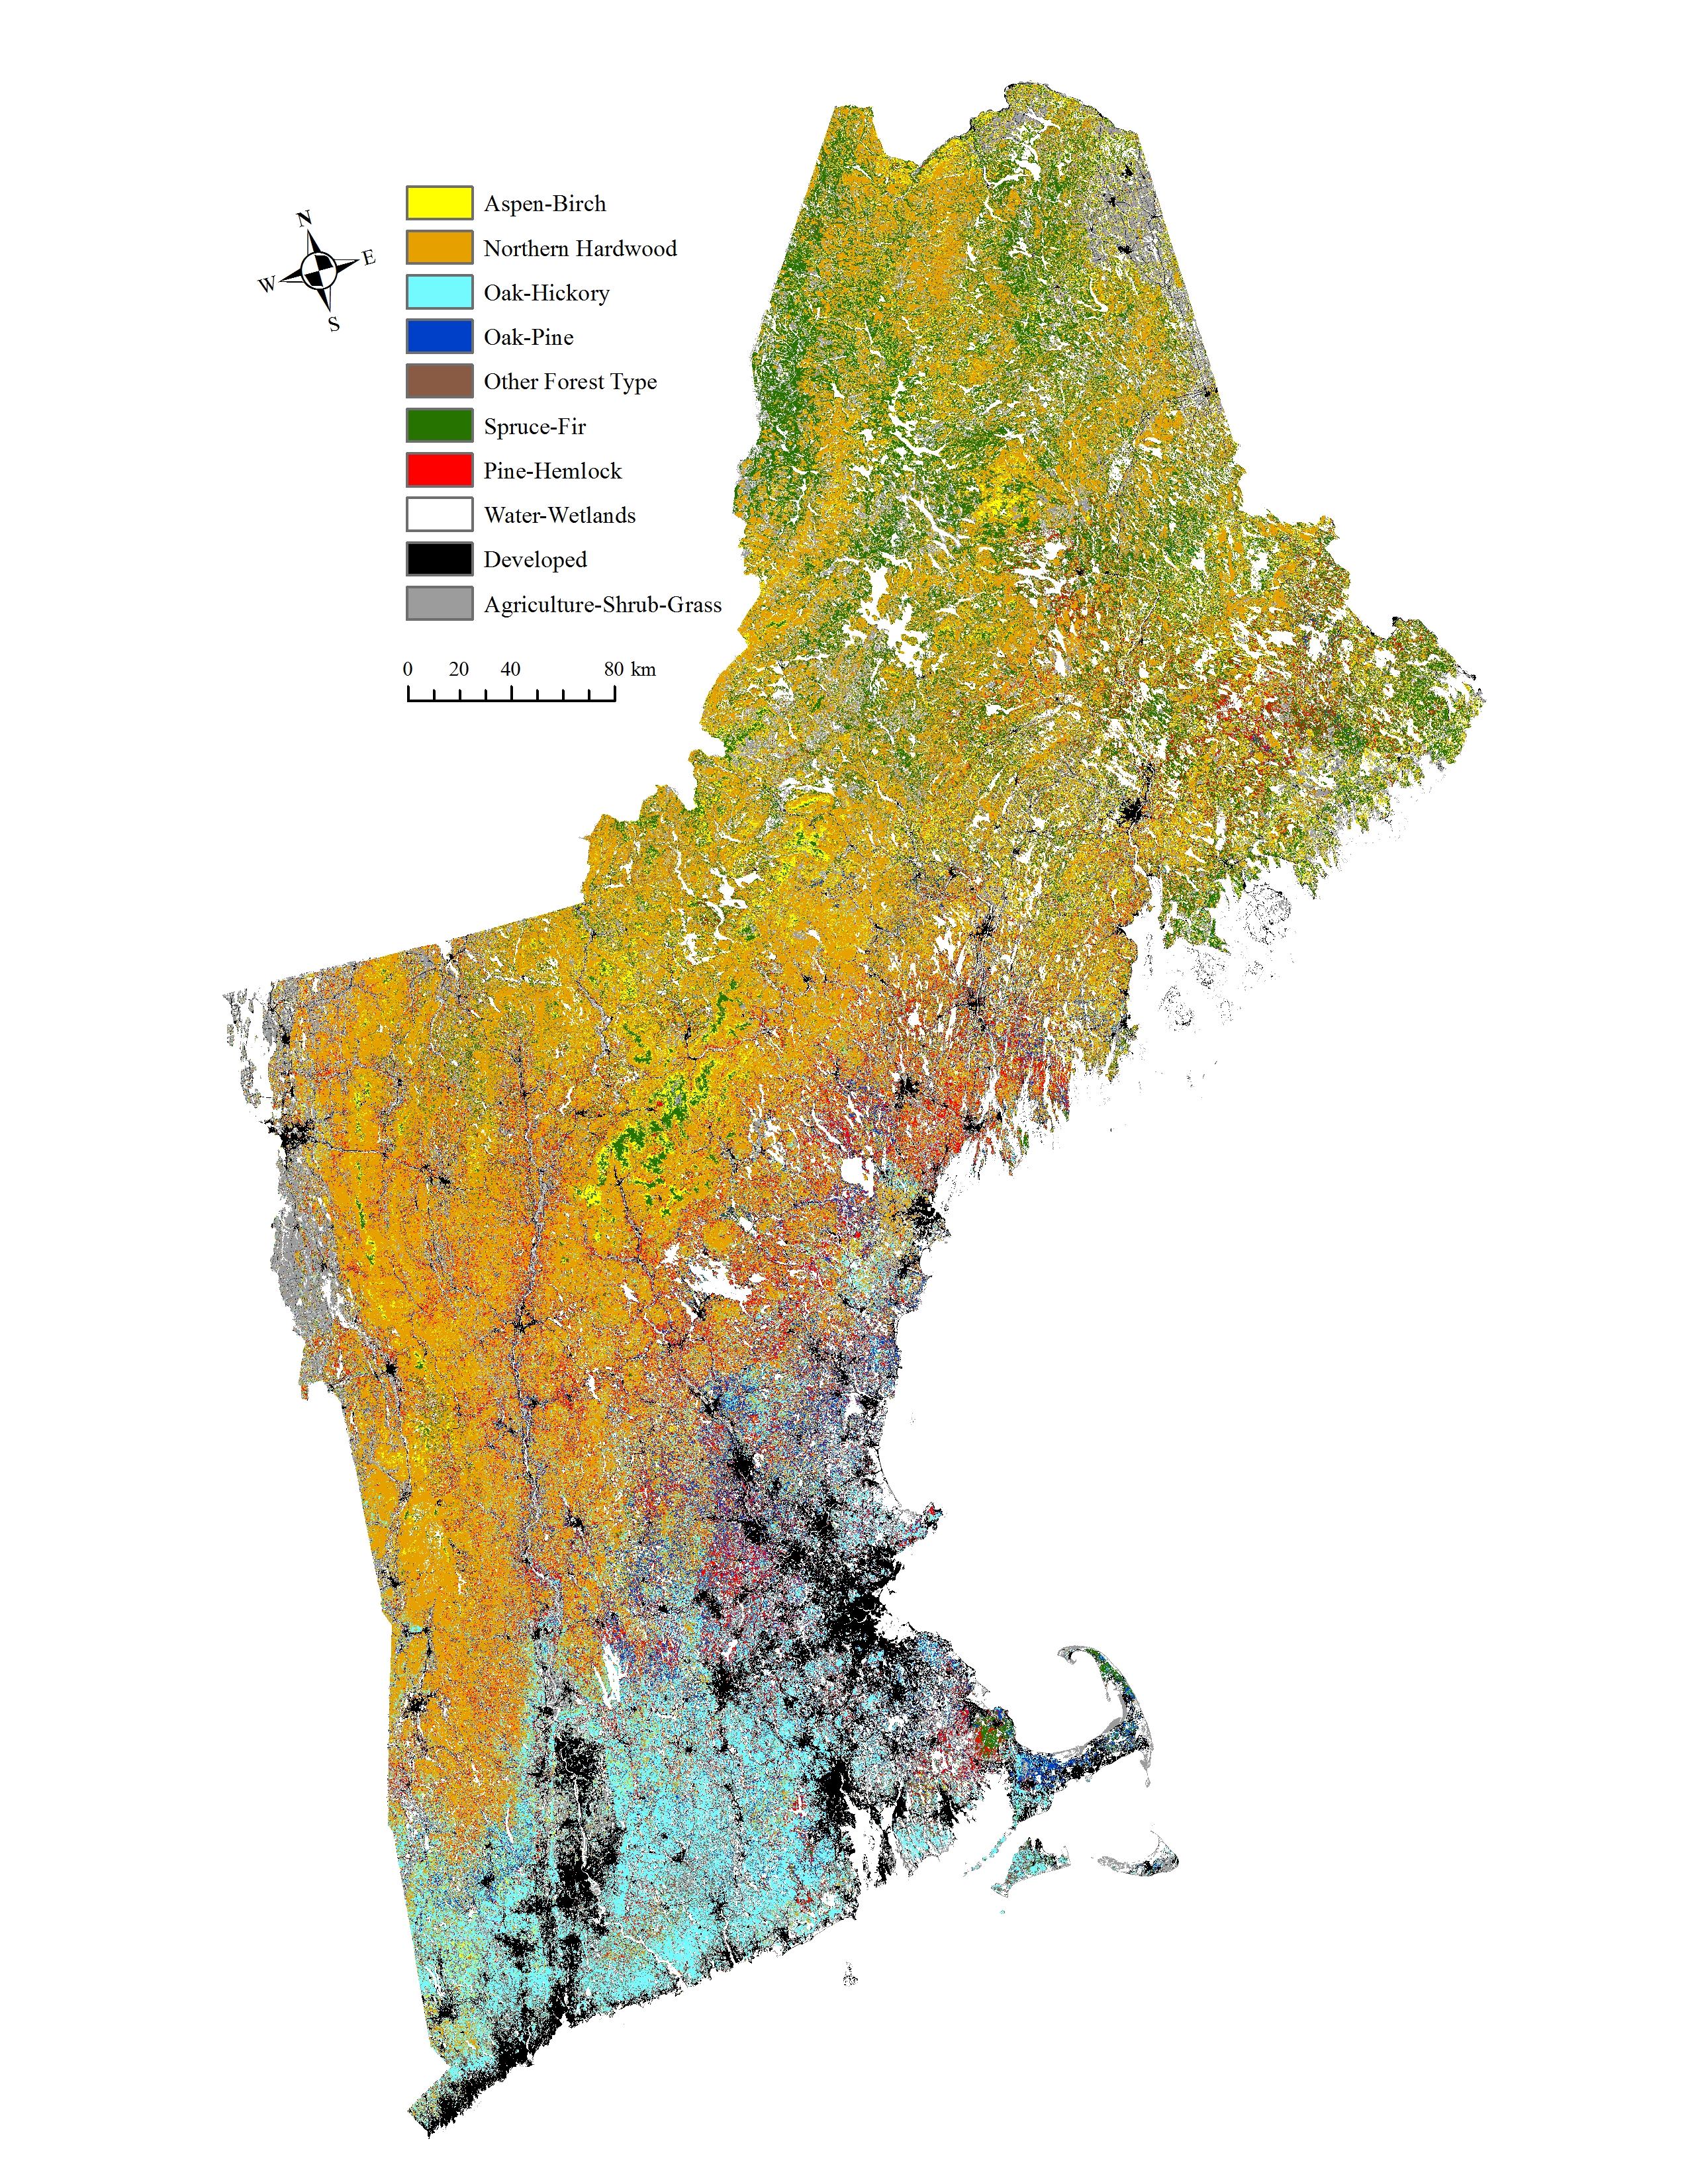
As a visual demonstration of the map, we built and plotted a forest type map of the landscape. To build the forest type map, we joined our final imputation map of FIA plot numbers with plot-assigned aggregated forest types. Imputation map is not only a representation of forest type; rather each pixel represents a FIA plot. Users of map can link to any FIA attribute measured at those plots (e.g., tree list, stem density, basal area, biomass, etc.). Non-forest classifications come from National Land Cover Database (2011)).
Citations
Foster, D. R. (1992). Land-use history and vegetation dynaimcs in central New England, USA. Journal of Ecology, 80(4), 753–771.
Foster, D. R., and Aber, J. D. (2004). Forests in time: The environmental consequences of 1,000 years of change in New England. Ecology (Vol. 36, p. 491).
Foster, D. R., Donahue, B., Kittredge, D. B., Fallon-Lambert, K., Hunter, M., Hall, B., … Hart, C. M. (2010). Wildland and Woodlands: A Forest Vision for New England (p. 36). Cambridge, MA: Harvard University Press.
Homer, C., Fry, J., and Barnes, C. (2012). The national land cover database. US Geological Survey Fact Sheet. Retrieved from http://pubs.usgs.gov/fs/2012/3020/
Little, E. L. (1971). Atlas of United States trees: Vol. 1. Conifers and important hardwoods. U.S. Department of Agriculture Miscellaneous Publication 1146 (pp. 1–877). Retrieved from http://kbd.kew.org/kbd/detailedresult.do?id=144273
Tang, G., and Beckage, B. (2010). Projecting the distribution of forests in New England in response to climate change. Diversity and Distributions, 16(1), 144–158. doi:10.1111/j.1472-4642.2009.00628.x
Thompson, J. R., Carpenter, D. N., Cogbill, C. V, and Foster, D. R. (2013). Four Centuries of Change in Northeastern United States Forests. Plos One, 8(9), e72540. doi:10.1371/journal.pone.0072540
Wilson, B. T., Lister, A. J., and Riemann, R. I. (2012). A nearest-neighbor imputation approach to mapping tree species over large areas using forest inventory plots and moderate resolution raster data. Forest Ecology and Management, 271, 182–198.
- Organization: Harvard Forest. 324 North Main Street, Petersham, MA 01366, USA. Phone (978) 724-3302. Fax (978) 724-3595.
- Project: The Harvard Forest Long-Term Ecological Research (LTER) program examines ecological dynamics in the New England region resulting from natural disturbances, environmental change, and human impacts. (ROR).
- Funding: National Science Foundation LTER grants: DEB-8811764, DEB-9411975, DEB-0080592, DEB-0620443, DEB-1237491, DEB-1832210.
- Use: This dataset is released to the public under Creative Commons CC0 1.0 (No Rights Reserved). Please keep the dataset creators informed of any plans to use the dataset. Consultation with the original investigators is strongly encouraged. Publications and data products that make use of the dataset should include proper acknowledgement.
- License: Creative Commons Zero v1.0 Universal (CC0-1.0)
- Citation: Duveneck M, Thompson J, Wilson B. 2023. Imputed Forest Composition Map for New England Screened by Species Range Boundaries 2001-2006. Harvard Forest Data Archive: HF234 (v.6). Environmental Data Initiative: https://doi.org/10.6073/pasta/826498f813973eea1bd386b2e14283a7.
Detailed Metadata
hf234-01: forest imputation map
- Compression: zip
- Format: Erdas imagine
- Type: raster GIS
hf234-02: forest type map
- Compression: none
- Format: jpeg
- Type: image
